

Introduction: When to Trust Your Smart Wearable
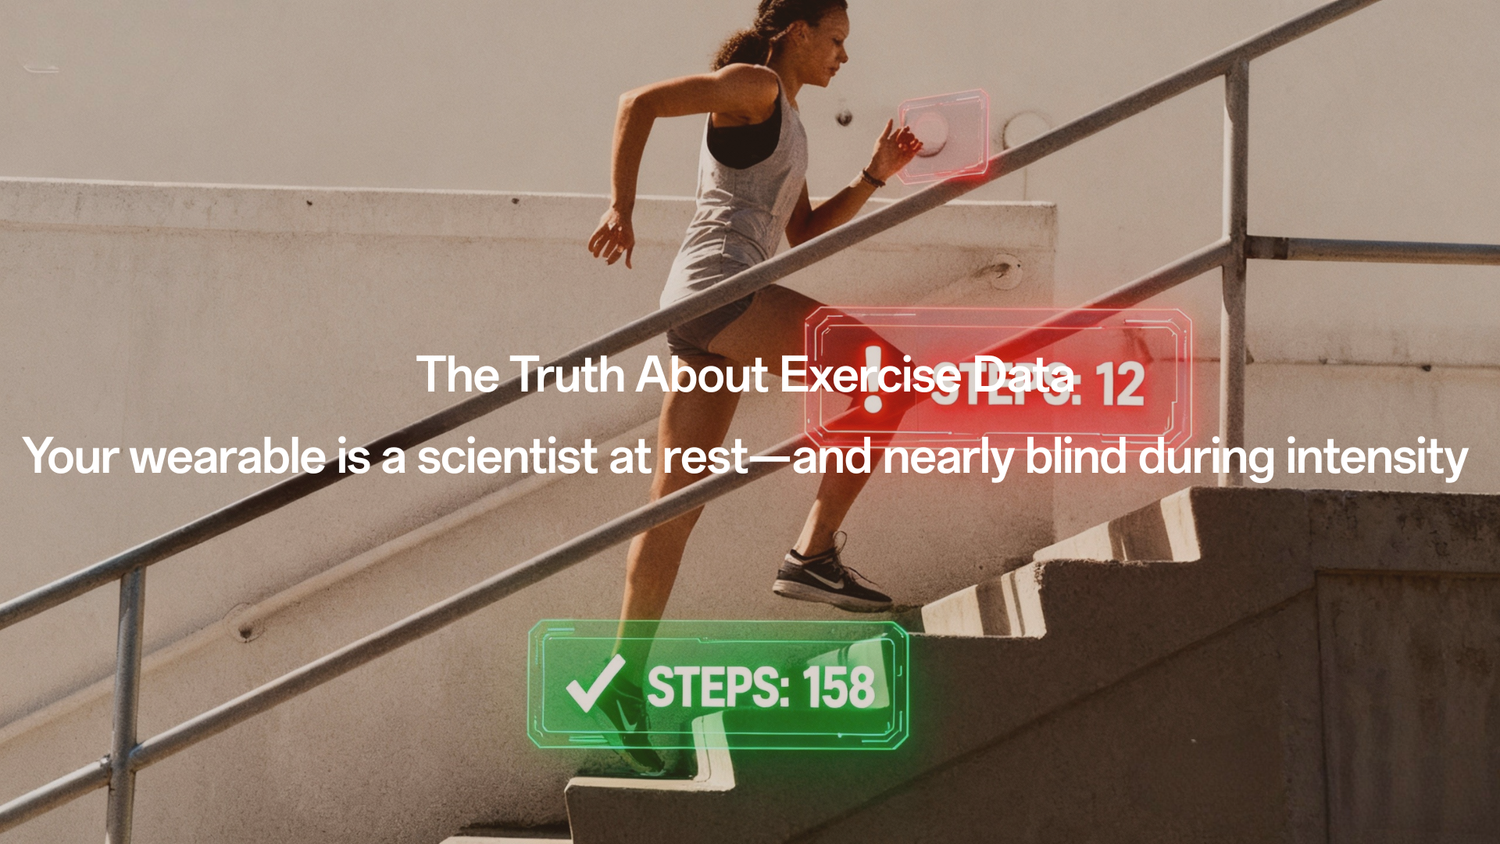
We tend to believe that the more expensive the smart wearable, the more accurate its data must be. But here’s the unexpected truth: The harder you work out, the less your device actually sees. This isn't necessarily because your product is flawed; it's because the underlying technology—the wrist-based photoplethysmography (PPG) sensor—was never designed to handle chaos.
This recognition forces a vital shift in perspective. If you are using these devices to guide critical health decisions, you must stop treating them like clinical monitors during a marathon. Our core stance is that the smart wearable is an expert in "resting health" but an amateur during "vigorous exercise." The real value lies not in tracking everything, but in knowing the precise, practical rules for when your data is dependable and how to interpret its reliable signals. Metrics like resting heart rate (HR) and heart rate recovery (HRR) are powerful, independent predictors of cardiovascular health, but they are only useful if they are accurate.
Chapter 1: Heart Rate’s “Golden Window”: Trusting the Quiet
The first rule of reliable data is simple: trust the stillness. The PPG sensor, which uses light to measure blood flow, achieves its highest accuracy when you are barely moving.
2.1 Expert Performance: The Silence is Golden
When you are resting, recovering, or sleeping, the heart rate readings are nearly flawless. Studies testing simulated light activities—like sitting, recovery phases, or easy movement (using protocols such as light walking, chair-rise tests, and step tests)—demonstrate that devices show excellent accuracy in measuring HR at rest and during recovery. The median absolute percentage error (MAPE) in these quiet phases is typically ≤ 3%. In human terms, your device’s resting heart rate measurement is almost certainly correct—you can rely on it to establish your baseline health.
2.2 The Pitfall: When PPG Sensors “Go Blind”
But once you start pushing the intensity, the PPG sensor effectively “goes blind”.
This is where the optical mechanism breaks down. Rapid arm movements, reduced contact pressure between the sensor and skin, and sweating all degrade the light signal. This disruption, known as motion artifact, causes accuracy to decrease significantly during peak exercise.
The data confirms this challenge: while the majority of readings during high-intensity periods are still technically accurate, the frequency of substantially incorrect measures (outliers) increases sharply. Studies show that the percentage of recordings with errors greater than 20% increases from typically <5% at rest to between 10% and 30% during peak exertion. This high error rate explains why many users feel their running heart rate data is erratic or jumping around—the measurement is struggling to cope with the chaos you are generating.
This challenge is so persistent that even specific movement types matter: errors were observed to be larger during step tests than during walk tests, suggesting that the complexity of arm movement during stepping is particularly disruptive to the PPG sensor.
Chapter 2: The Activity Protocol Trap—How You Move Matters More Than Your Watch
The heart rate isn't the only metric vulnerable to movement issues; distance and step counts are equally dependent on how you choose to exercise.
3.1 The Hidden Pitfall of Turning
The protocol of movement is as crucial as the hardware. A study assessing remote exercise capacity monitoring revealed that the path you take matters more than the device you wear for distance accuracy.
| Movement Protocol | Description | Accuracy (MAPE) | Implication |
|---|---|---|---|
| Standard Straight Laps (30 m) | Mimics walking up and down a corridor, requiring frequent, sharp turns. | 18.8% to 20.1% | High Error. Frequent turning compromises GPS and tracking algorithms. |
| Continuous Circular Laps (240 m) | Mimics walking freely around a park, requiring minimal sharp turns. | 6.4% to 8.0% | Better Accuracy. More suitable for remote monitoring. |
Translation for Users: Simply put, the smoother and more stable the exercise path, the better the reading. If you are walking straight and continuously, your device is more accurate than if you are constantly walking short distances, stopping, and turning around. Bland–Altman analysis confirmed that both device types tended to underestimate the distance walked, and this bias was significantly greater with the straight-lap protocol.
3.2 Prioritize Activity-Based Assessments
The accuracy of complex derived metrics, such as aerobic capacity (VO2max), also relies on activity. A meta-analysis confirmed that when devices calculate VO2max:
-
Estimates based on resting tests tend to significantly overestimate true capacity, with errors spanning ±15.24%.
-
Estimates based on exercise tests show much narrower error limits, spanning ±9.83%.
The Takeaway: If your device offers different ways to estimate fitness, always prioritize the one that requires you to actively move.
Chapter 3: Unlocking Resilience—HRV as Your Body’s Silent Sentinel
If the first two chapters focused on heart rate quantity and location, this chapter addresses the quality and meaning of the most advanced health metric the wearable offers: heart rate variability (HRV).
4.1 HRV: The Real Indicator of Stress and Adaptation
HRV measures the natural fluctuation in the time interval between consecutive heartbeats. This metric is a powerful, non-invasive indicator of your autonomic nervous system (ANS) function—the system that controls involuntary processes like stress response and recovery. A high HRV signals efficient adaptation and resilience; a low HRV suggests the body is under stress, struggling to cope, or potentially facing chronic disease.
Story Translation: Those mornings when you feel groggy, overly stressed, or "off," HRV has likely been signaling that internal state for hours. HRV changes are influenced by exercise, sleep quality, psychological stress, and long-term health status.
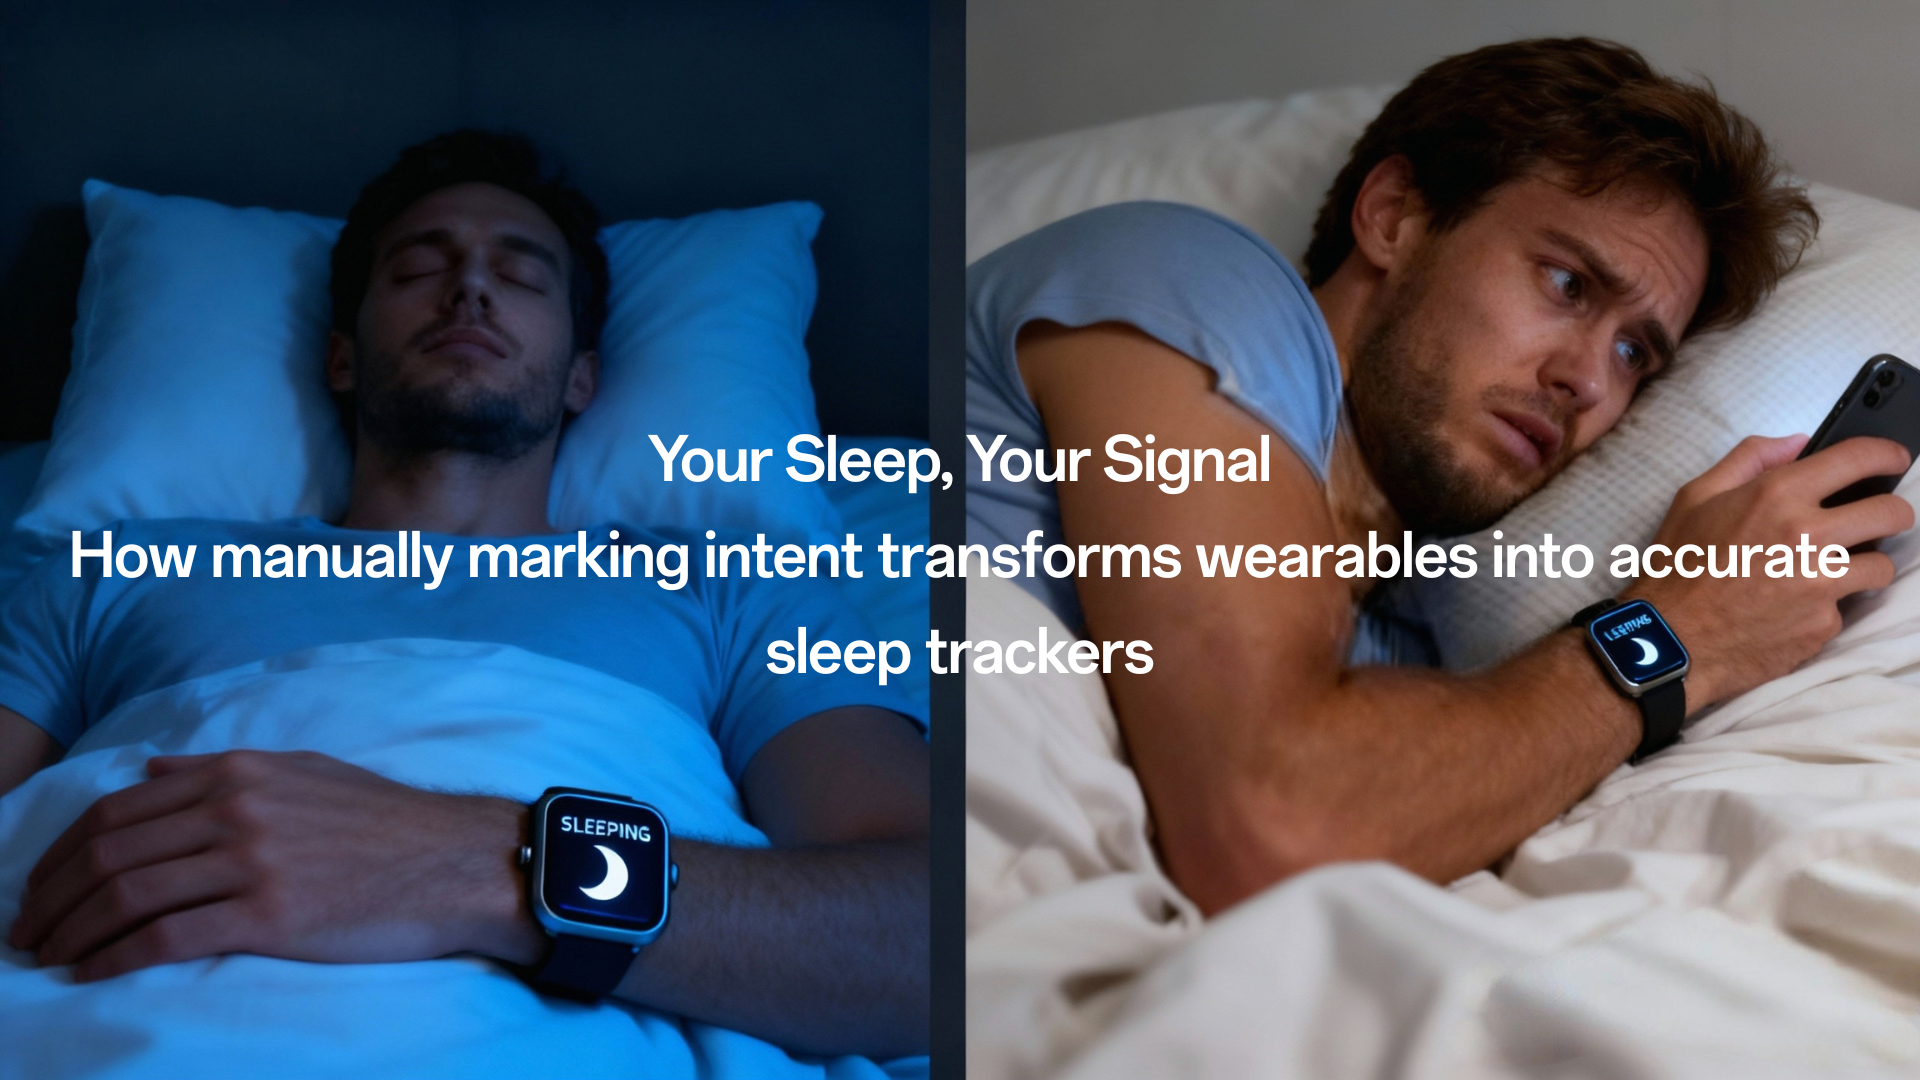
4.2 The Mandate for Sleep Tracking
Because HRV relies on capturing minute changes in interbeat interval (IBI), it is extremely sensitive to measurement noise. Studies show that PPG-derived HRV metrics show good-to-excellent agreement with gold-standard ECG measures when measurements are taken at rest. However, this agreement decreases as the level of exercise and motion increases.
The Data Requirement: To ensure good data quality for calculation, especially during resting states, devices must collect at least 60 valid IBI data points within a 5-minute time window.
4.3 Unlocking Early Warning Signals
When this high-quality, static HRV data is collected longitudinally and compared against an individual's personalized healthy baseline, it creates a powerful diagnostic tool. This approach has been scaled by using machine learning models to calculate a "health risk score." This score tracks deviations from an individual's normal state. The scientific premise is compelling: through this monitoring, physiological changes linked to viral respiratory infections can be detected presymptomatically. This continuous, automated monitoring offers crucial lead time for individuals to adjust their behavior or seek care, highlighting HRV’s ultimate clinical utility.
Chapter 4: The Future of Accuracy—Practical Trends Beyond the Wrist
Reliable data isn't just about how we use existing devices; it's about solving the PPG noise problem through technological evolution.
5.1 Beyond the Wrist: New Measurement Sites
To maximize accuracy, we must look beyond the wrist. Understanding this trend is key to anticipating where the most accurate monitoring will come from next.
Research has begun validating heart rate measurement at highly peripheral sites, finding that PPG sensors can be used effectively on foot arteries. Specifically, a 2025 study found that measurements taken from the posterior tibial artery (PTA) showed superior precision and less error compared to the dorsalis pedis artery (DPA). This validates the use of peripheral sites (like integrating sensors into smart footwear) for unobtrusive, continuous HR monitoring. This innovation moves the sensor away from the high-motion interference of the wrist.
5.2 The Crucial Feasibility Check: Long-Term Adherence
Even with perfect technology, if the device is inconvenient, the data is useless. This is the feasibility hurdle for continuous monitoring.
In real-world studies lasting several months, researchers found that wearable technology struggled with data gaps. The median valid data fraction (VDF)—the percentage of time the device recorded clean, usable health information—was only about 48% over an eight-month monitoring period. Meanwhile, the artifact data fraction (ADF), representing unusable noisy data, had a median of 30%. The data tells us that even the most compliant users only receive valid metrics roughly half the time, highlighting the persistent challenge of motion and poor contact.
To achieve reliable long-term monitoring, devices must meet strict feasibility criteria:
-
Battery Life: Devices should ideally have a long battery life (>7 days) to ensure uninterrupted continuous monitoring.
-
Comfort: The device must be unobtrusive, with low discomfort (e.g., wrist- or ring-worn) to maximize long-term adherence.
-
Validation: For clinical use, devices must have their accuracy verified against a gold or reference standard, particularly in the crucial resting state.
Conclusion: Mastering the Rules of Reliable Data
The era of trusting every blink and beep from a smart device is over. You do not need to treat your wearable device as a doctor, but you must treat it as a scientist. It is not built to be a clinical gold standard during high-intensity exercise, but it is a uniquely powerful tool for uncovering crucial health trends.
By mastering these practical rules, you can transform unreliable data into actionable insights:
| Rule | Action | Reliability Supported By |
|---|---|---|
| Prioritize Stillness | Trust HR and HRV only during rest or sleep. During peak exercise, PPG sensors have increased outlier rates, confirming the devices are ≤3% accurate at rest. | Evidence from motion artifact studies. |
| Standardize Movement | Choose continuous paths (like walking in large circles) over frequent stops and turns. The continuous protocol resulted in ~6% distance errors, versus nearly 20% for standard turns. | Bland–Altman distance analysis. |
| Focus on Resilience | Track HRV as your body’s stress barometer. Low HRV may predict susceptibility to illness, and elevated risk scores can flag physiological anomalies before symptoms appear. | Longitudinal HRV monitoring studies. |
Ultimately, your wearable is responsible for telling you about your body's recovery, stress load, and capacity—these are the core metrics that truly determine long-term health. Filtering out the noise, understanding the measurement protocols, and demanding high data quality are the essential steps to making your smart device truly work for you.

Efterlad en kommentar
Denne side er beskyttet af hCaptcha, og hCaptchas Politik om beskyttelse af persondata og Servicevilkår er gældende.