

Introduction: Your Smartwatch’s Most Valuable Secret
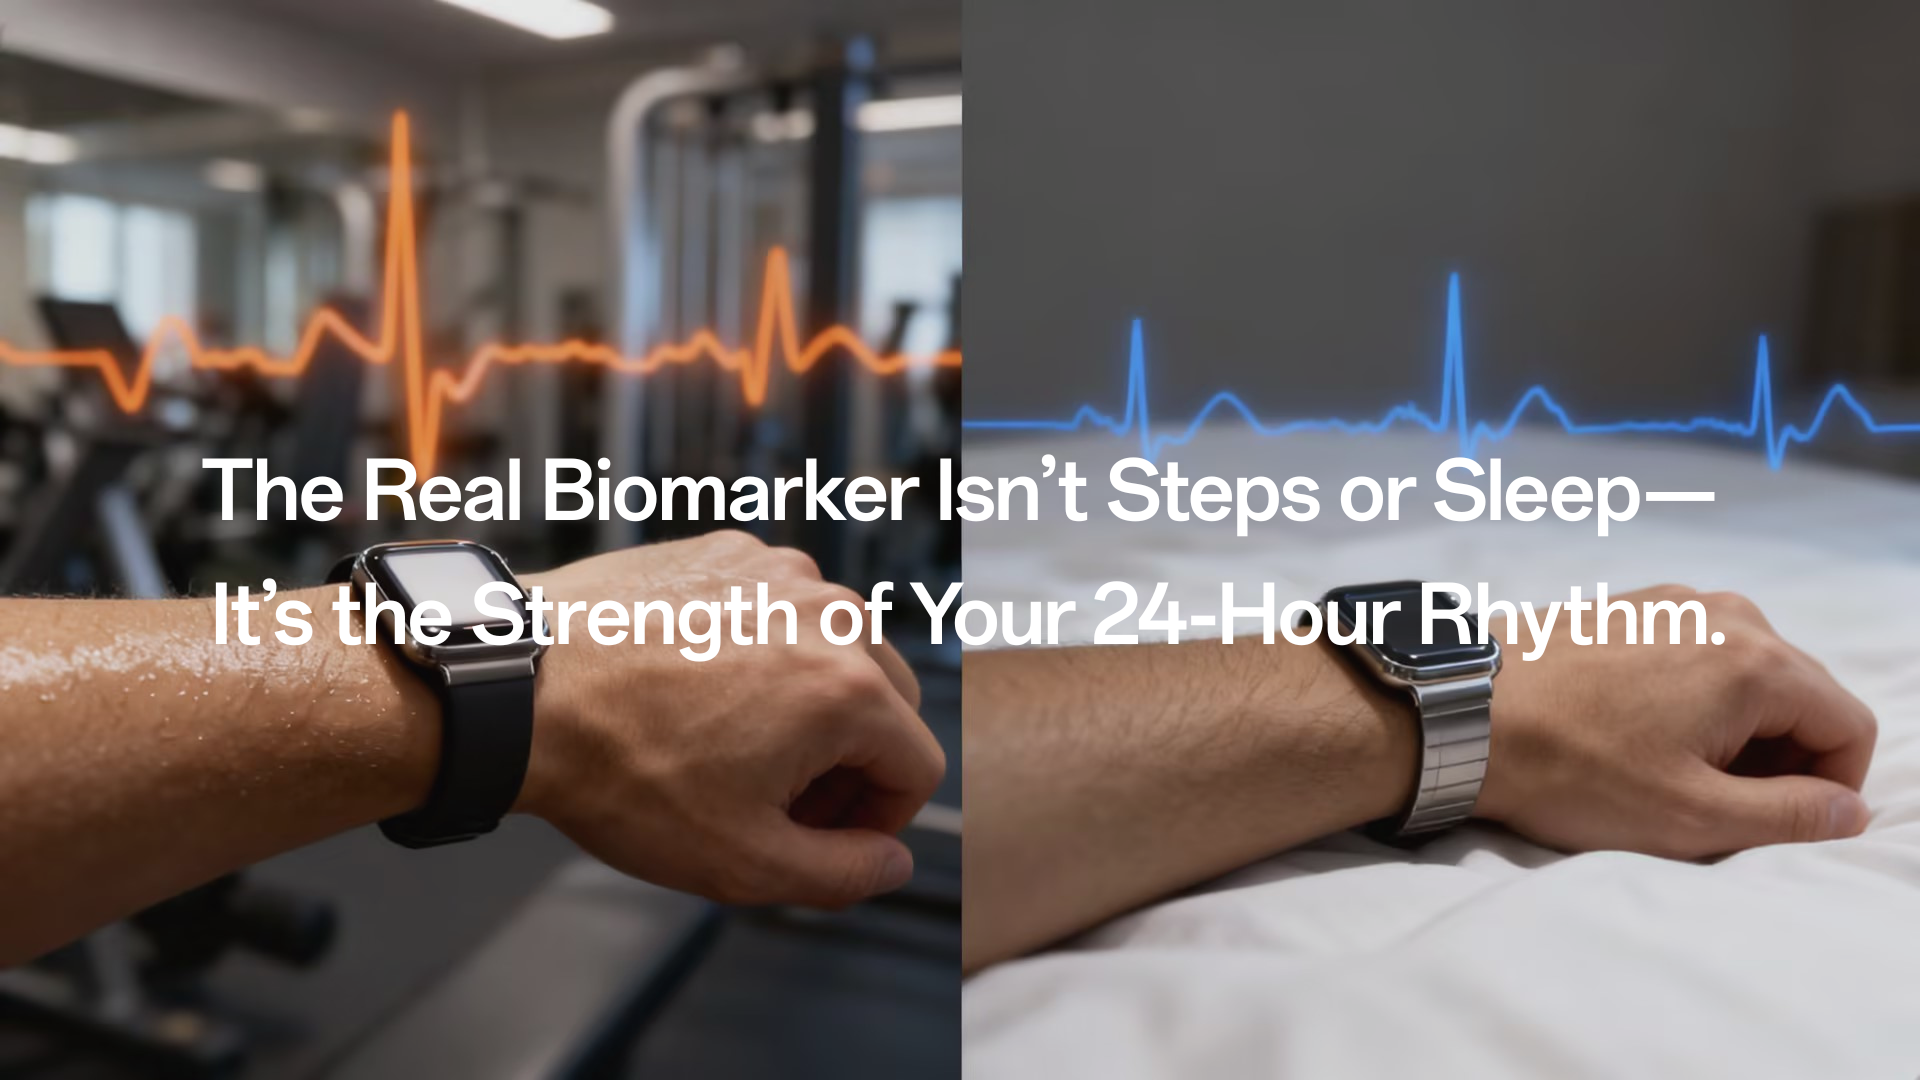
We all measure basic health metrics—steps, heart rate, calories burned. But if you want a single, powerful data point that reveals your system’s true capacity to handle stress, bounce back from illness, and manage fatigue, you need to look at Heart Rate Variability (HRV).
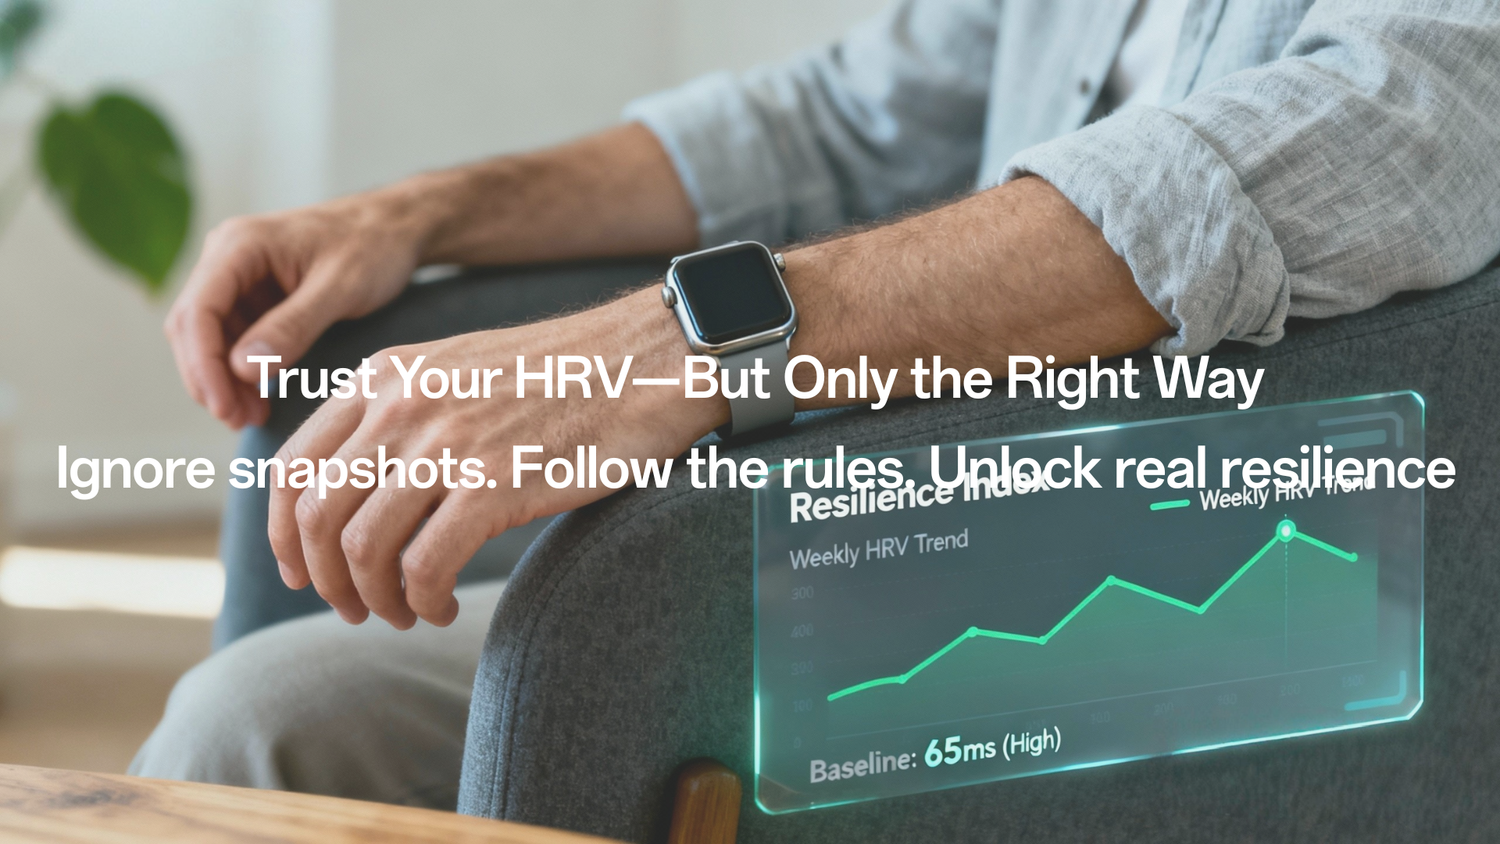
HRV is not about how fast your heart beats, but how adaptable the intervals between those beats are. It is the most sophisticated, yet most fragile, metric your wearable provides. The device’s highest clinical value is achieved during stillness, making a reliable tool for deep health insight. HRV is your body’s Resilience Index. To utilize this index effectively—to truly predict stress, fatigue, or illness—you must first understand the stringent data quality rules that govern its reliability.
Chapter 1: The Core Logic: Why HRV is Your Nervous System’s Report Card
The fundamental purpose of HRV is to provide an objective score of your body's ability to adapt. This ability is controlled by a continuous, silent negotiation between two opposing forces.
2.1 HRV: The Invisible Battle for Control
This chapter defines HRV not as a simple data point, but as the reflection of your dynamic health.
Measures the subtle fluctuations in the time between heart beats, revealing the function of the Autonomic Nervous System. HRV comprises two main components:
-
The Sympathetic Nervous System: The "action system" or "fight-or-flight" mode. It increases heart rate and blood pressure to prepare the body for stress or challenge.
-
The Parasympathetic Nervous System: The "rest and digest" system that promotes recovery, working to decrease heart rate and blood pressure.
The HRV value reflects the constant balance between these two systems. An efficient system maintains a high degree of variability, indicating good adaptability. Think of high HRV as the neurological equivalent of a deep, calm breath—a sign the system is not perpetually operating in an emergency mode. Low HRV is associated with reduced psychological status, fatigue, and is considered an independent risk factor for cardiovascular events and all-cause mortality.
2.2 What Impacts Your Resilience Index?
To correctly interpret HRV trends, one must acknowledge that this resilience metric is influenced by a multitude of factors, including age, fitness level, stress, smoking, and medication. This is why comparing your HRV score to population norms is misleading; your true value is highly personalized, making the device’s long-term tracking ability critical.
Chapter 2: The Practical Rules for Maximizing HRV Reliability
This chapter addresses the biggest challenge: HRV requires immaculate data. We must understand why PPG sensors struggle and what constitutes "clean" data.
3.1 Why HRV is Hard to Measure Correctly
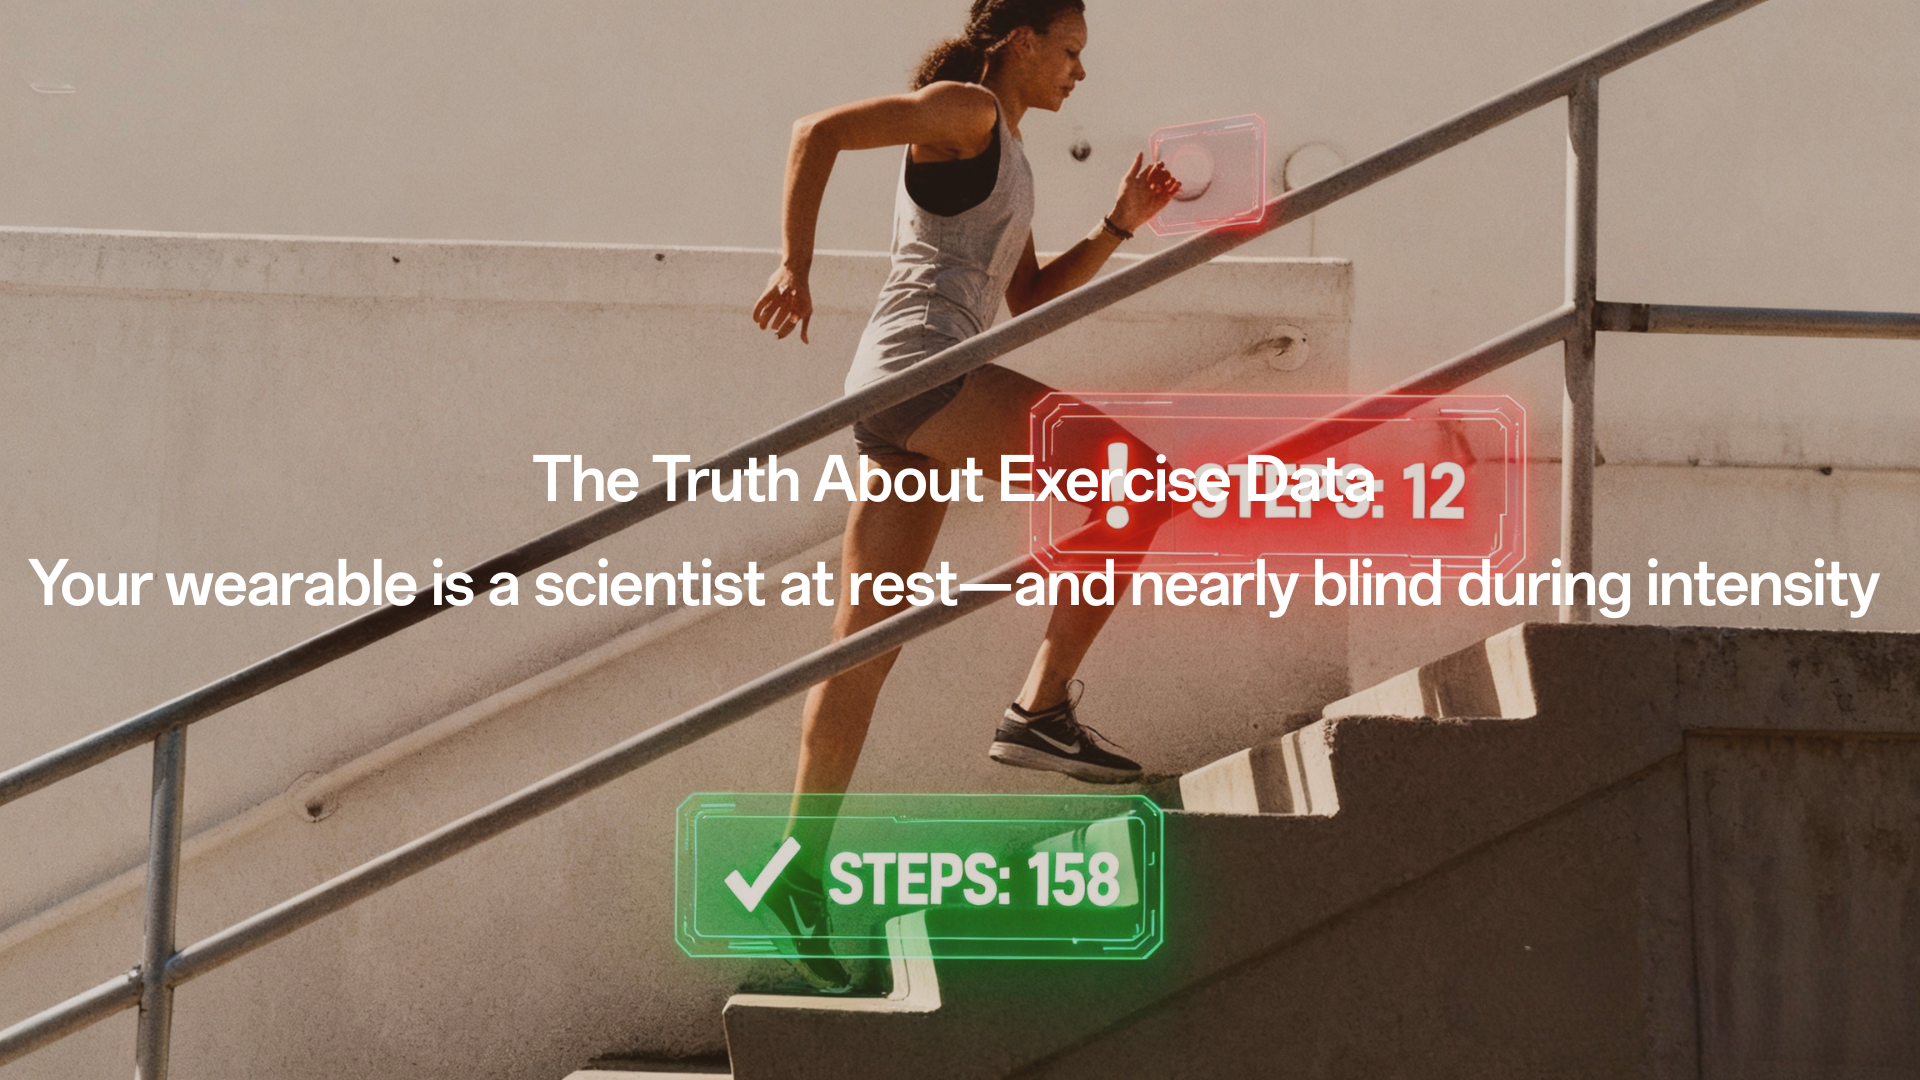
The power of HRV is contingent upon the accuracy of the underlying heart rhythm data (Interbeat Interval, or IBI). The primary limitation is the Photoplethysmography (PPG) sensor used in most smartwatches.
-
PPG’s Achilles' Heel: While PPG-derived HRV metrics show generally good agreement with the gold-standard ECG, this agreement deteriorates sharply in the presence of physical activity, motion artifacts, cold exposure, and other external factors. This is why you cannot trust a 30-second reading taken while walking to the coffee machine.
3.2 The Mandate for Sleep Tracking
Since stillness is required, the majority of research and commercial devices rely on measuring HRV during the most stable, controlled physiological state: sleep.
-
The Golden Rule: HRV measurements taken during rest or sleep are the most precise and reliable.
3.3 Decoding the Scientific Quality Check
In scientific studies, simply wearing the device is not enough; researchers must quantify data quality because noise is inevitable in free-living conditions.
-
The Artifact Problem (ADF): Long-term monitoring faces inherent challenges. The Artifact Data Fraction (ADF)—the percentage of removed, unusable data—is frequently high. In one study, the median ADF for IBI data was 30%. This means a third of the data gathered in continuous, real-world monitoring is often compromised by movement or poor wear, confirming that data cleaning is vital.
-
The Requirement for Validity (VDF): To ensure a clean signal, researchers require specific data density. Even when the device records data, the Valid Data Fraction (VDF) may be low if the device is not properly worn. To calculate a good quality HRV metric, research protocols require at least 60 valid IBI data points in each 5-minute sampling epoch (i.e., at least 1 minute of clean data per 5-minute period). What this means: To accurately capture your resilience score, the system needs focused, sustained stillness to filter out all that noise.
Chapter 3: Short-Term Utility—HRV for Daily Load and Recovery Management
This chapter focuses on the immediate, day-to-day value of HRV: interpreting deviations from your individual baseline to manage stress and fatigue.
4.1 HRV as an Objective Stress Barometer
HRV is strongly associated with psychological and physiological stress. Reduced HRV signifies poor ANS adaptability, fatigue, and potential overtraining.
-
Stress Differentiation: HRV is generally seen as a more direct reflection of transient physiological stress (instant burnout) rather than chronic perceived stress. The ANS response, which HRV measures, is primarily limited to the duration of the stressor.
-
Mental Health Context: A strong relationship exists between low HRV and anxiety and depression symptoms. HRV biofeedback, which uses guided breathing to optimize ANS function, has been shown to improve symptoms of anxiety and depression.
4.2 The Challenge of Daily “Snapshots”
While long-term tracking is best, many wearables offer ultra-short-term (e.g., 1-minute) or random intermittent daily measurements.
-
The Noise Risk: These "snapshot" readings fall into the ultra-short-term category and are easily influenced by immediate external factors like coffee intake, stress, or posture changes. Without a detailed log of the user’s activity at that random time, it is difficult to discern if the reading reflects the true baseline or just a momentary response to a stimulus.
-
Long-Term Superiority: Meaningful interpretation of longitudinal HRV data is improved by using weekly averages of consecutive day-to-day recordings, which are superior to snapshot measures.
The Takeaway: Your daily (e.g., nocturnal) HRV score is an invaluable tool for making short-term decisions—it's the system's objective report on immediate recovery and physiological load.
Chapter 4: Long-Term Power—From Resilience to Risk Prediction
This chapter focuses on the long-term, predictive value of HRV: utilizing established baselines over weeks and months to detect chronic risk and early signs of illness.
5.1 Long-Term Risk: Predicting Cardiovascular Stress
When tracked over an extended period, low HRV moves from being a stress indicator to a significant clinical risk marker.
-
Heart Disease: A low HRV value at baseline is associated with an increased risk of developing hypertension over time. Furthermore, low HRV strongly predicts sudden cardiac death (SCD) in patients with chronic heart failure.
-
Arrhythmia Detection: Reduced HRV (specifically a decrease in SDNN) is correlated with an increased risk of Atrial Fibrillation (AF) development. The popularity of wearables provides a unique opportunity to study HRV correlation with heart health in a large, healthy population, which was previously limited by the cost and convenience of traditional ECG methods.
5.2 The Early Detection Revolution
Continuous monitoring of HRV and related activity metrics facilitates the creation of predictive models that can flag illness before symptoms appear.
-
The Risk Score Model: Researchers utilize HRV and activity data to calculate a multivariate anomaly score (health risk score) relative to an individual’s personalized healthy baseline. This approach leverages the fact that changes in HRV can occur shortly after cytokine levels increase during systemic inflammation, preceding the onset of flu-like symptoms.
-
Predictive Feasibility: This risk score has demonstrated promise as an indicator of viral respiratory illness, including COVID-19. In an exploratory study, an increase in this risk score was detected prior to and coinciding with self-reported symptoms of illness. This validates HRV not just as a reflection of current stress, but as a critical component of a prospective, near real-time health assessment system.
Conclusion: Maximizing the Resilience Index
The availability of long-term HRV data offers profound insight into health, but its utility is determined by the user's adherence to data quality rules.
If you want reliable HRV:
-
Mandate Stillness: Recognize that HRV must be measured during periods of minimal motion (rest or sleep) to be accurate.
-
Focus on Trends: Ignore single, ultra-short-term "snapshot" readings (often lasting only 1 minute). Instead, rely on the longitudinal tracking of weekly or monthly averages to establish a stable, personal baseline that is superior to population norms.
-
Ensure Quality: Support continuous tracking by minimizing device interruptions and understanding that high-quality data requires the sensor to achieve sufficient valid IBI data points during collection.
Final Thought: You do not need to treat your wearable device as a physician. But by focusing your trust on the data it gathers during rest and sleep, you unlock its full potential to serve as your personal Resilience Index, providing objective truth about your body’s ability to adapt, recover, and sustain long-term health.
Leave a comment
This site is protected by hCaptcha and the hCaptcha Privacy Policy and Terms of Service apply.